The Planes That Didn't Return: A Freehold / Leasehold Analysis
Amidst WWII in 1943, American bombers were suffering heavy losses to German counter-air defense. A team of military engineers were tasked with reinforcing the armour of the planes. Statistician Abraham Wald and his team from the Statistical Research Group of Columbia University were given data on aircraft damage of returning planes, including the parts that were most hit by the Nazis. Engineers wanted to reinforce the wings and fuselage, most riddled with bullet holes. Wald argued the opposite: armour the engines and cockpit, the fewest-hit spots. Because planes hit there... never made it back.

A repeat-sale property return calculation has the same blind spot: it can only measure units that actually changed hands. Over the trailing 12 months to July 2026, 99-year leasehold apartments and condominiums returned 3.62% annualised against freehold's 3.22%, a 0.40-point gap (Proposition analysis of URA caveat data, Aug 2025-Jul 2026).
Tenure | Pairs | Avg. annualised return | Median | Std. dev. |
|---|---|---|---|---|
99-year leasehold | 7,670 | 3.62% | 3.55% | 2.21 |
Freehold (incl. 999-yr) | 3,608 | 3.22% | 3.17% | 2.13 |
The gap sits well inside one standard deviation of either group. As with any figure from this database, a standing caveat applies: caveat data lags by weeks to months, covers only caveated transactions, and does not capture the full market.
Which raises the sharper, Wald-shaped question: could freehold's "gone quiet" projects be the property equivalent of the planes that never returned? Not silent because they're undesirable, but because owners are sitting on a winner and choosing not to sell.
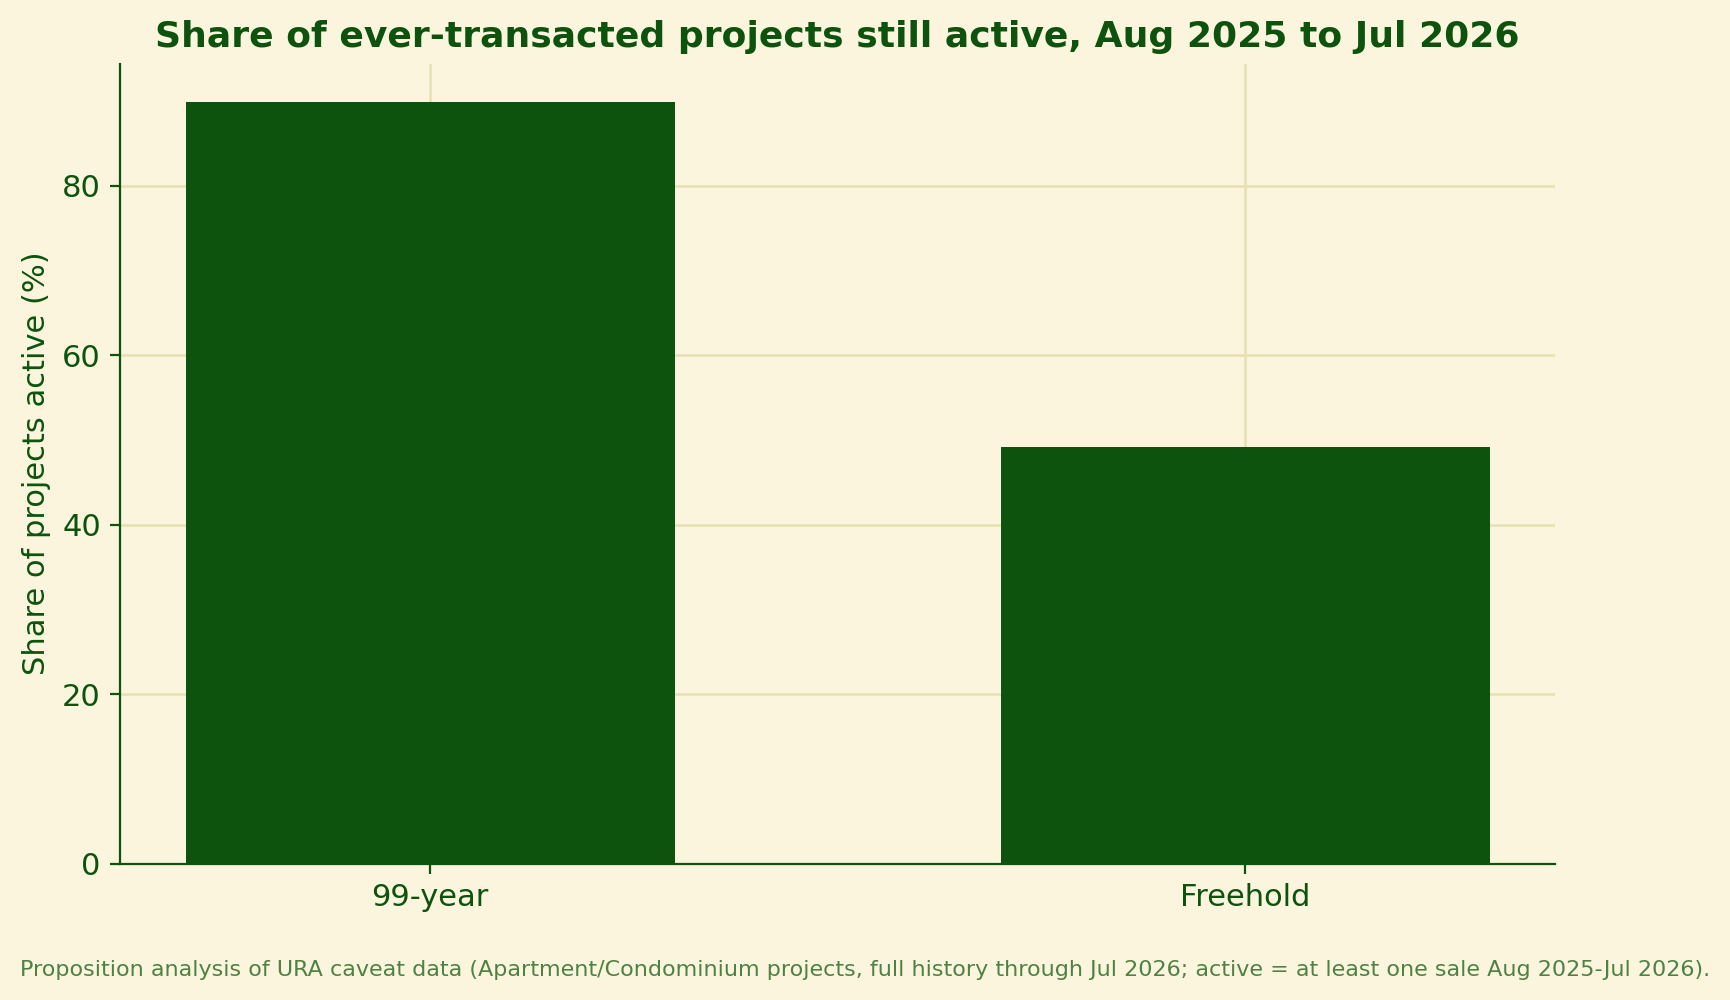
Whatever the answer, there's a simpler caveat the headline comparison needs regardless. Freehold recorded just 4,938 transactions against 99-year leasehold's 15,707 over the trailing 12 months, about 30% of leasehold's volume (Proposition analysis of URA caveat data, Aug 2025-Jul 2026). The same thinness shows up at the project level: only 49.1% of every freehold project ever transacted made a sale in that window, against 89.9% for leasehold (Proposition analysis of URA caveat data, full history through Jul 2026). Read the 3.62% versus 3.22% headline comparison with that in mind: it's built on roughly a third of the transactions leasehold has behind it, a materially thinner slice of the market, not a like-for-like sample.
What the data does support is simpler: regional composition explains most of the raw gap.
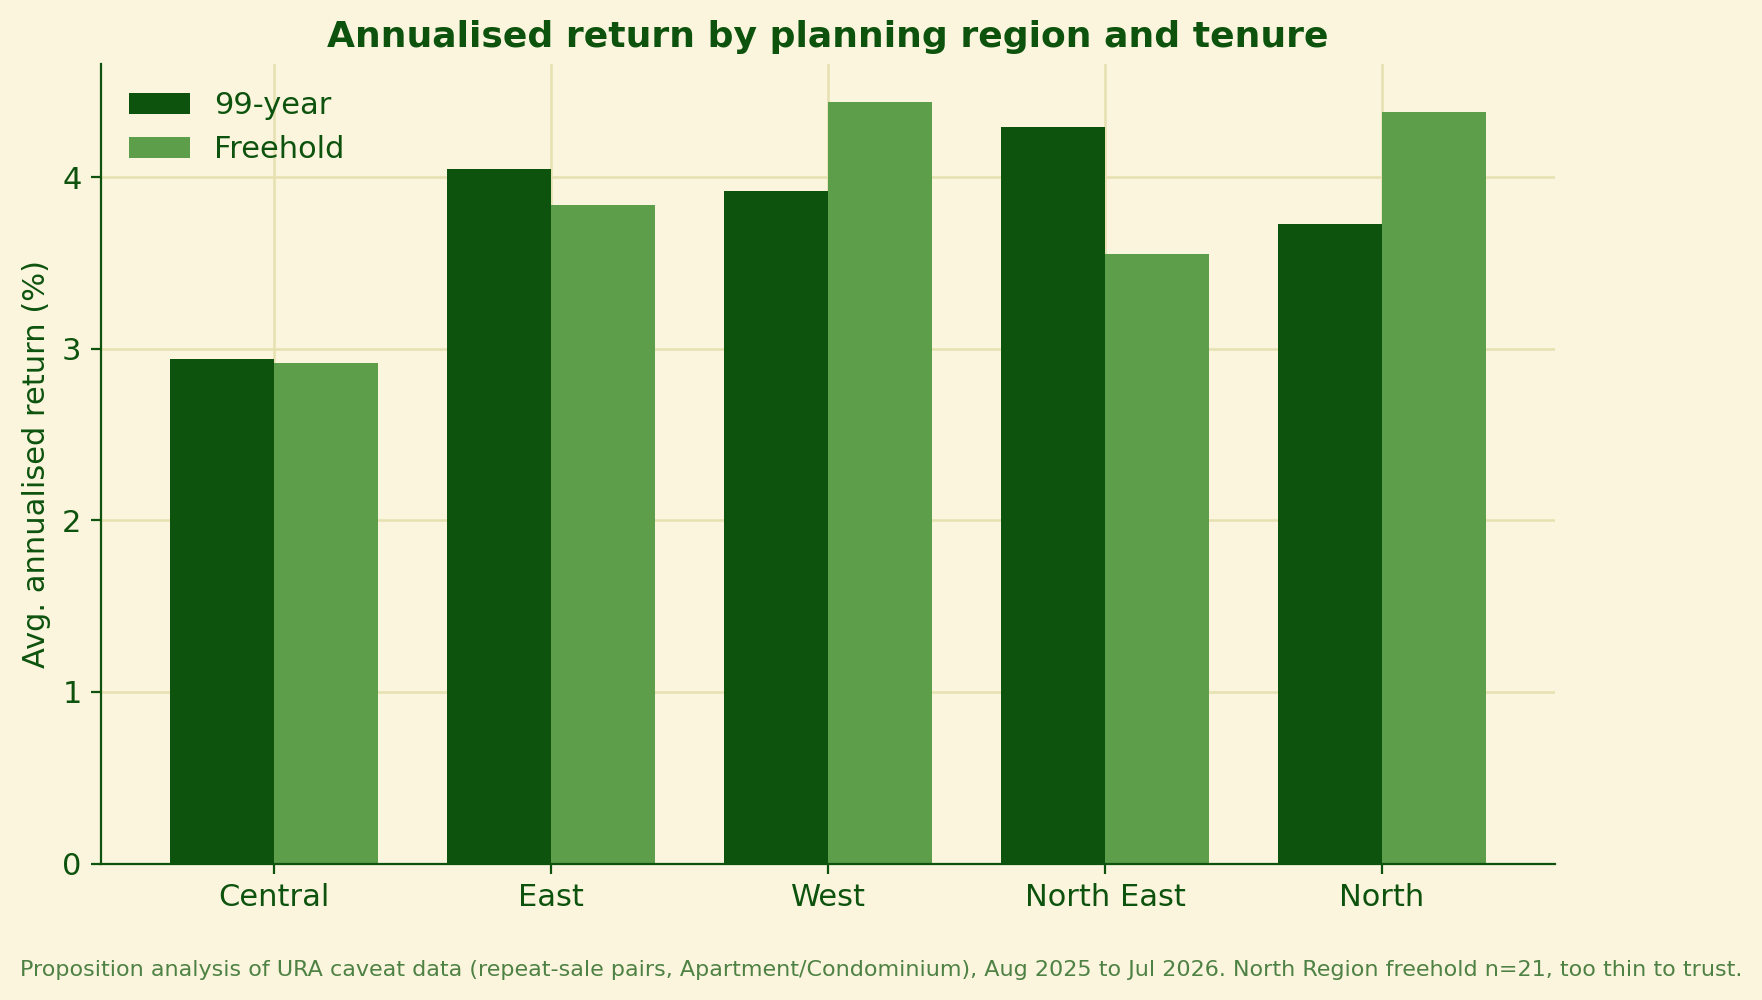
Freehold is not evenly spread across the island. Three quarters of its transaction volume sits in the Central Region (Proposition analysis of URA caveat data, Aug 2025-Jul 2026), the one region where the two tenures trade in comparable volume. Elsewhere, freehold is a thin, noisier minority of local supply. Region matters more than the raw comparison lets on: Central Region posted the lowest annualised return of any region for both freehold and leasehold properties, well below the 3.5-4.4% range seen everywhere else, so it's the one region where both tenures happen to be growing slowest. It is therefore incorrect to compare tenures without accounting for region.
Region | 99-year return (pairs) | Freehold return (pairs) |
|---|---|---|
Central Region | 2.94% (3,039) | 2.92% (2,531) |
East Region | 4.05% (1,536) | 3.84% (513) |
West Region | 3.92% (1,156) | 4.44% (273) |
North East Region | 4.29% (1,512) | 3.55% (270) |
North Region | 3.73% (427) | 4.38% (21, too thin to trust) |
In Central Region, where the comparison actually holds up, 99-year leasehold beat freehold by 0.02 points, not 0.40. Region, not tenure, does most of the work in the headline figure.
One caveat worth naming: this data may not fully capture en-bloc sales, where a project exits through a single collective payout rather than ordinary resale. A share of the "quiet" freehold stock in the numbers above could still be understating what those owners eventually receive.
Geography is doing the work here, not tenure and not owner behaviour. Freehold's concentration in a smaller set of neighbourhoods, not something structural about the tenure itself, is what the headline 0.40-point gap is mostly picking up.
One more wrinkle: the 0.40-point figure is a simple average, and moves under different weighting. Freehold pairs hold roughly 26% longer, 4,320 days against 3,362. Weight by holding period and the gap narrows to 0.16 points; weight by transaction value and it widens to 0.49. Treat 0.40 as a starting point, not a fixed number (Proposition analysis of URA caveat data, Aug 2025-Jul 2026).
None of this settles the question cleanly. If you hold a unit in a small, older freehold project untraded for years, the standard return calculation likely undersells it: a meaningful share of that stock eventually exits through collective sale, which this measure has no way to see. Choosing between freehold and 99-year in the Central Region, the tenure premium is barely there, 0.02 points, so decide on other grounds. Ultimately, Wald's lost planes might be found in the en-bloc deals that never show up in this data as individual units. He had a thing or two to teach about reading what the numbers leave out.
Data: Proposition analysis of URA caveat data, Aug 2025-Jul 2026 (trailing 12 months); survivorship figures drawn from full transaction history through Jul 2026.
Sources: Proposition analysis of URA caveat data.
Charts: 2 charts (share of projects still active by tenure; annualised return by planning region and tenure), rendered from the queries above. Two tables (headline return comparison; regional return breakdown) included in the body.